
Colored Area Analyse
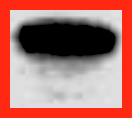
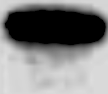
Image
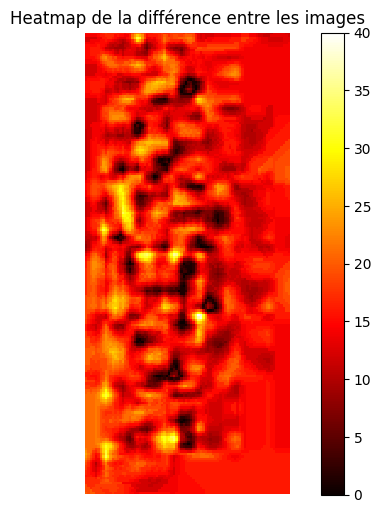
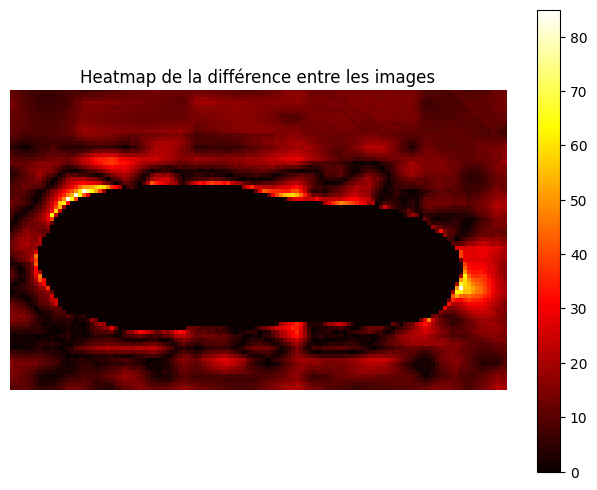
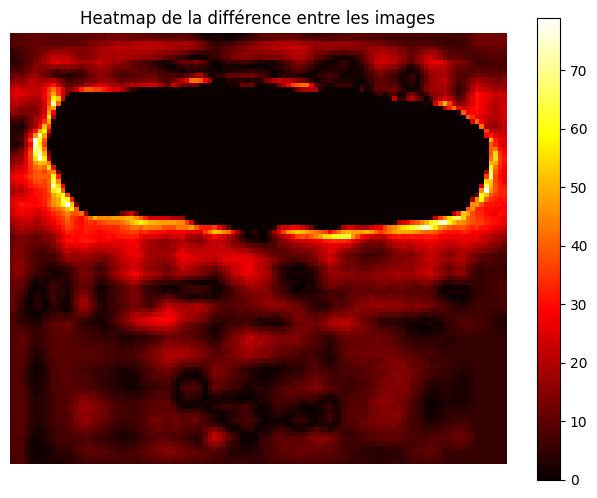
Analyse
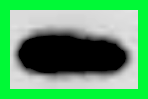
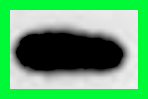
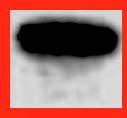
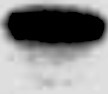
Detected Area


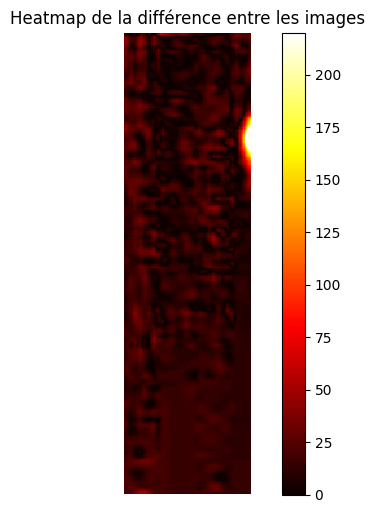
Metrics
| Color | mean-squared error | mean structural similarity | Hausdorff distance | num diff pixels |
|---|---|---|---|---|
| blue | 242.094 | 0.884 | 0.000 | 15915 |
| green | 143.108 | 0.937 | 2.000 | 6093 |
| red | 189.816 | 0.892 | 2.828 | 7490 |
| yellow | 391.305 | 0.792 | 4.472 | 34390 |