
Colored Area Analyse
Image
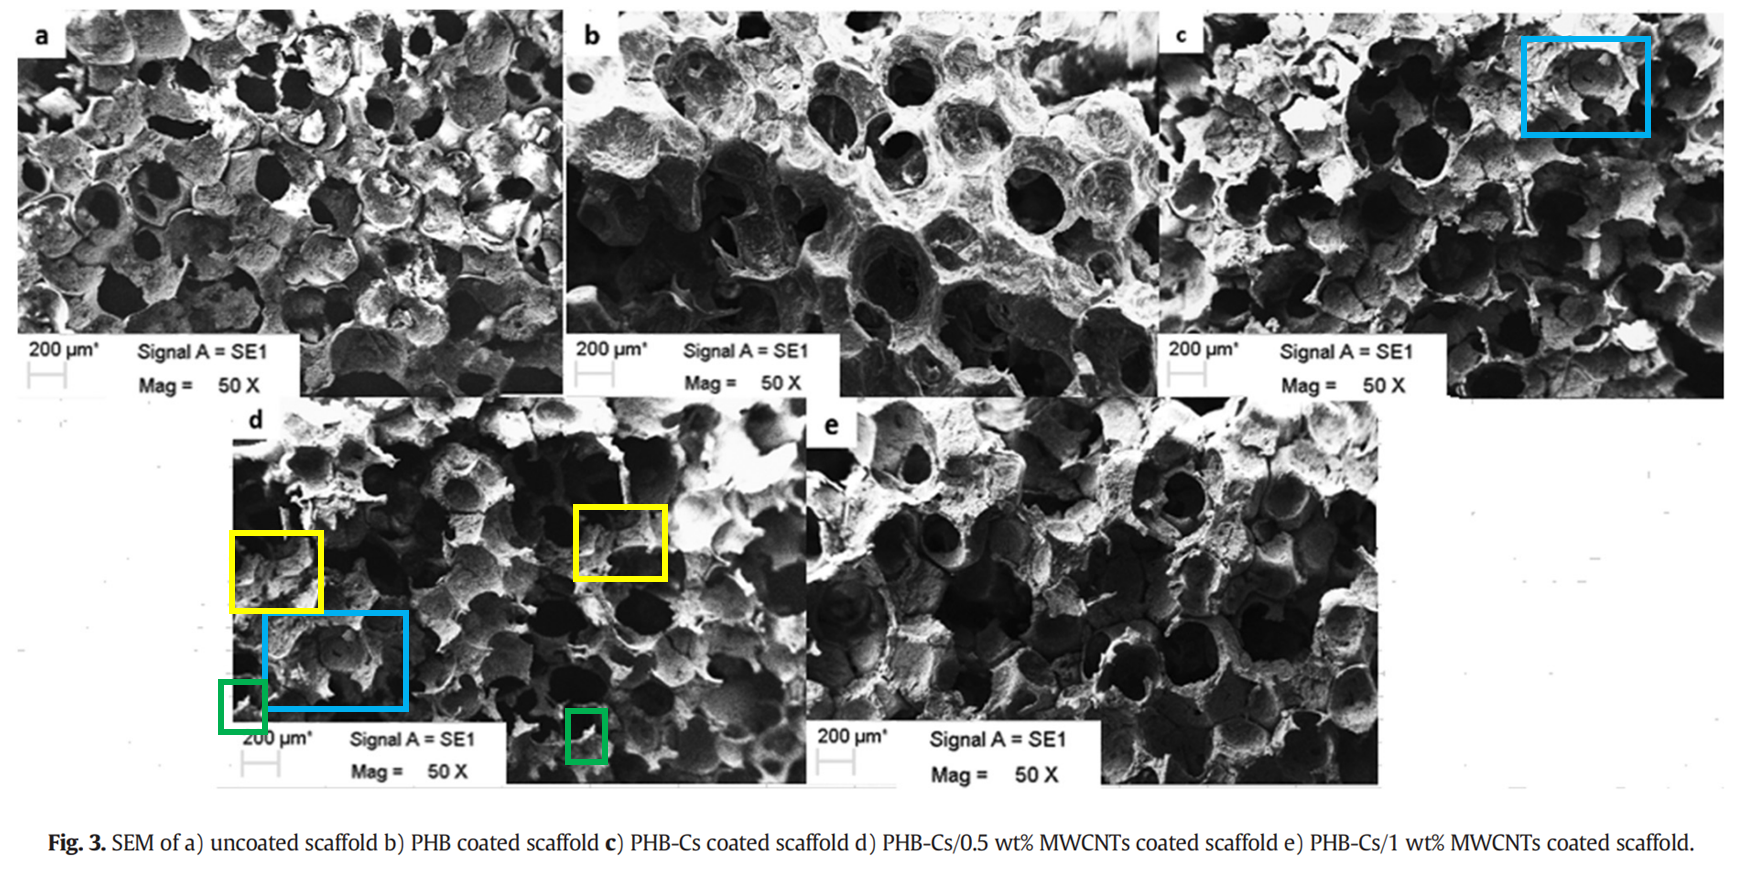
Analyse
Detected Area


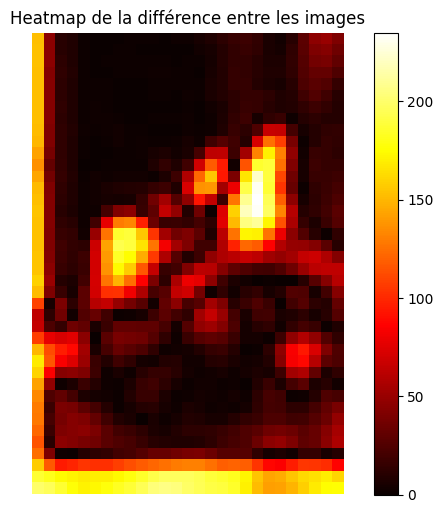
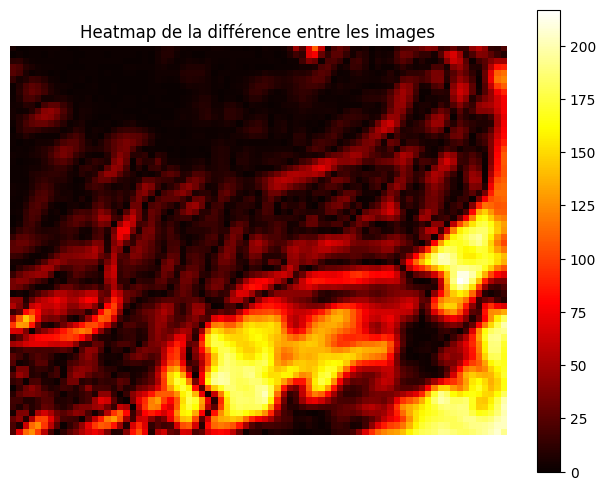
Metrics
| Color | mean-squared error | mean structural similarity | Hausdorff distance | num diff pixels |
|---|---|---|---|---|
| green | 4952.706 | 0.334 | 1.000 | 1031 |
| yellow | 4459.482 | 0.390 | 0.000 | 4713 |
| Color | mean-squared error | mean structural similarity | Hausdorff distance | num diff pixels |
|---|---|---|---|---|
| green | 4952.706 | 0.334 | 1.000 | 1031 |
| yellow | 4459.482 | 0.390 | 0.000 | 4713 |