
Colored Area Analyse
Image
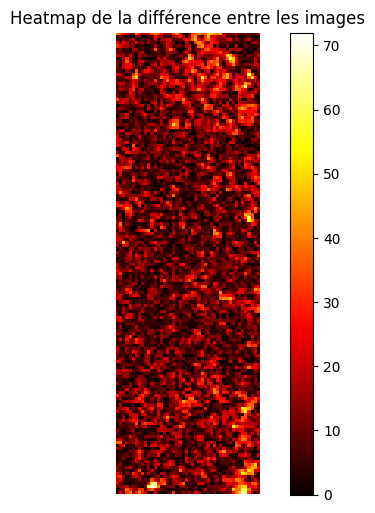
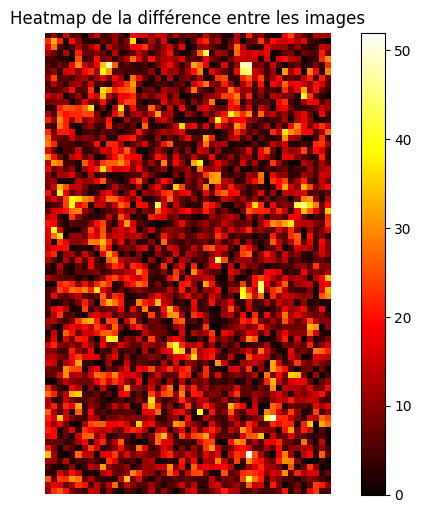
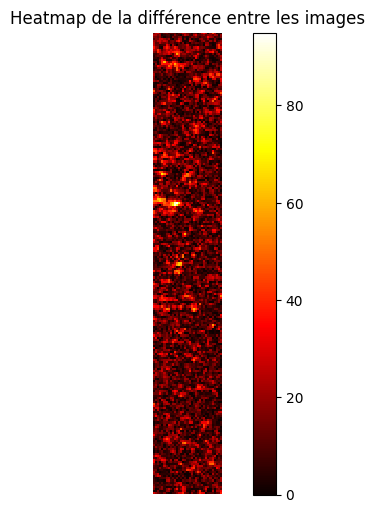
Analyse
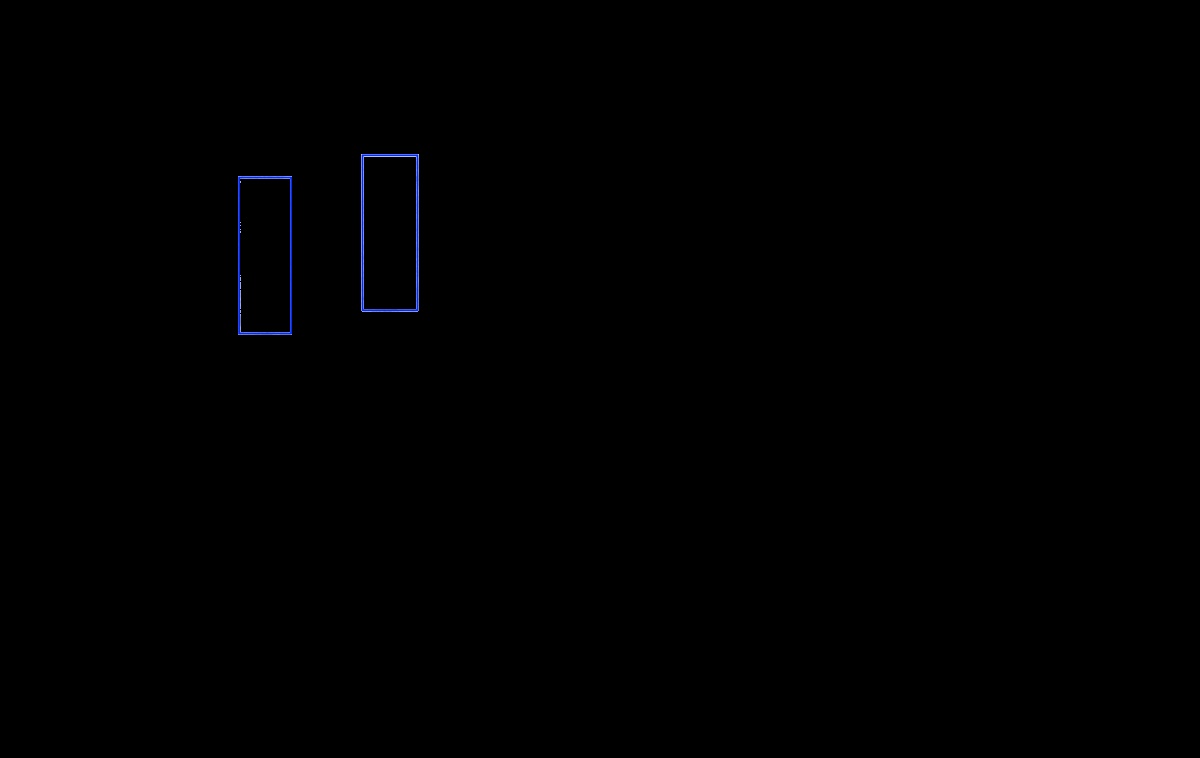
Detected Area


Metrics
| Color | mean-squared error | mean structural similarity | Hausdorff distance | num diff pixels |
|---|---|---|---|---|
| blue | 250.064 | 0.349 | 0.000 | 6708 |
| red | 209.648 | 0.400 | 0.000 | 3486 |
| yellow | 285.989 | 0.222 | 0.000 | 7254 |