
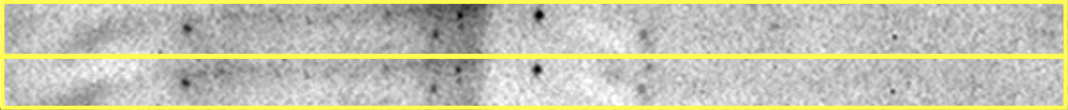
Colored Area Analyse
Image
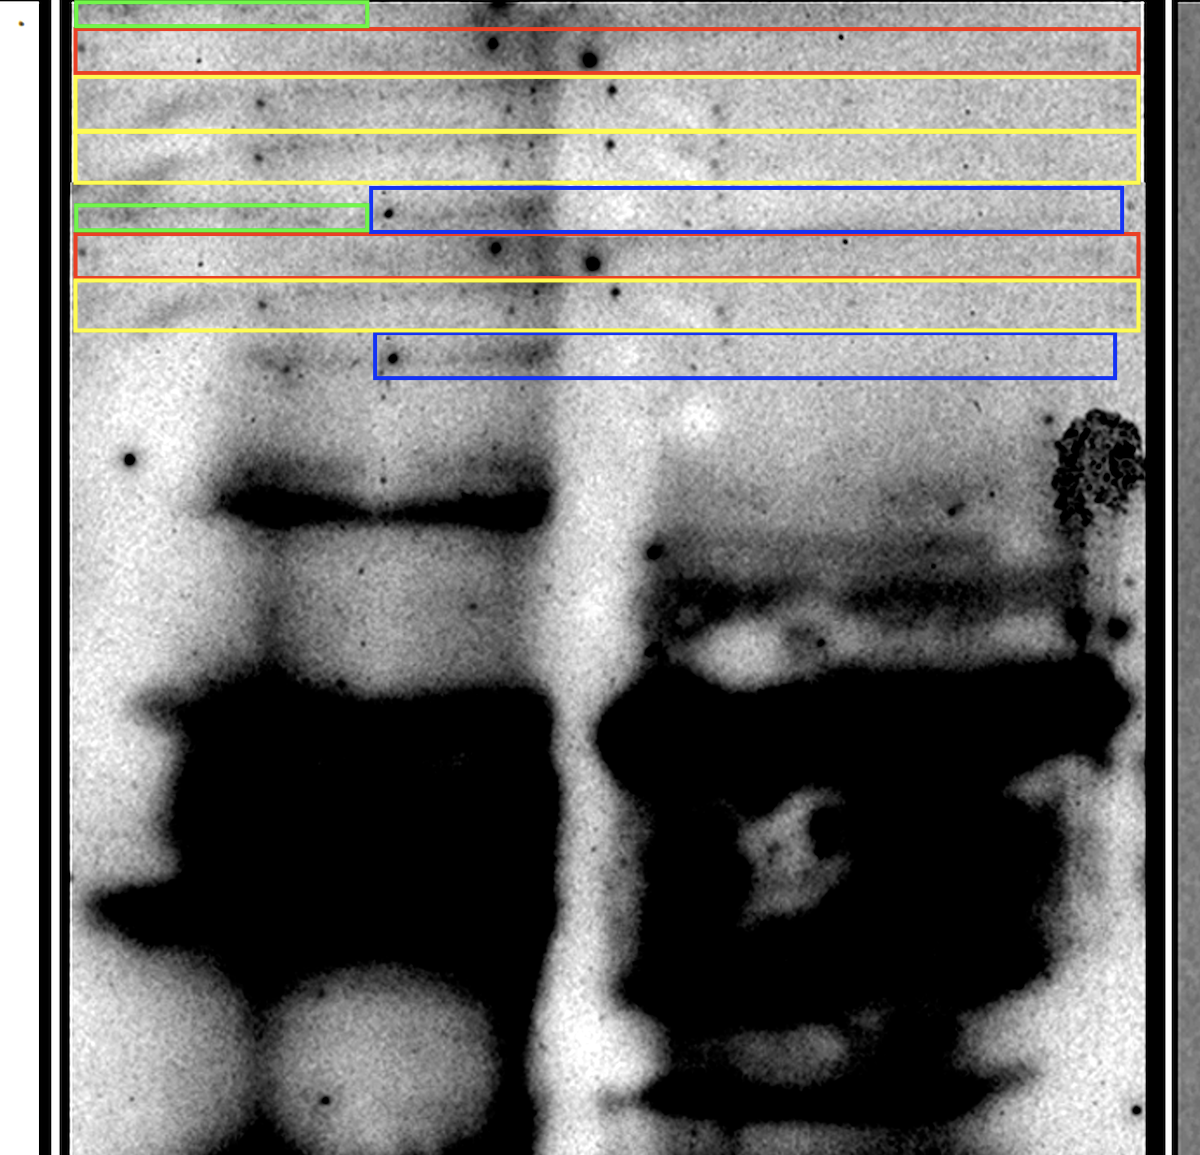
Analyse
Detected Area


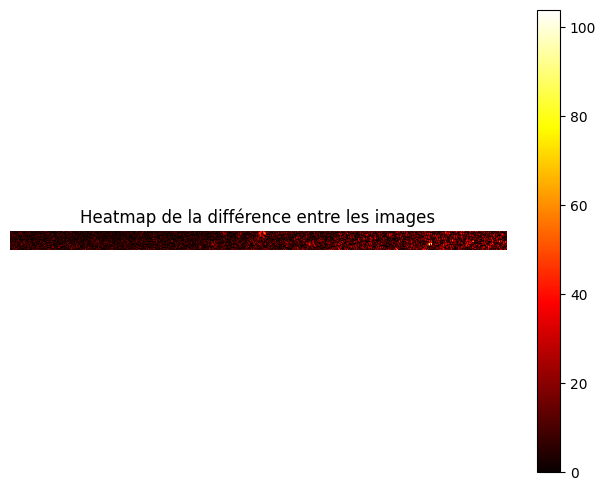
Metrics
| Color | mean-squared error | mean structural similarity | Hausdorff distance | num diff pixels |
|---|---|---|---|---|
| blue | 212.396 | 0.790 | 1.414 | 25618 |
| green | 74.568 | 0.839 | 0.000 | 3983 |
| red | 116.895 | 0.665 | 2.236 | 35935 |
| yellow | 118.779 | 0.648 | 1.000 | 41168 |