
Colored Area Analyse
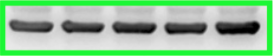
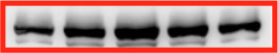
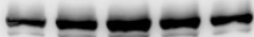
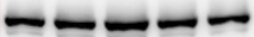
Image
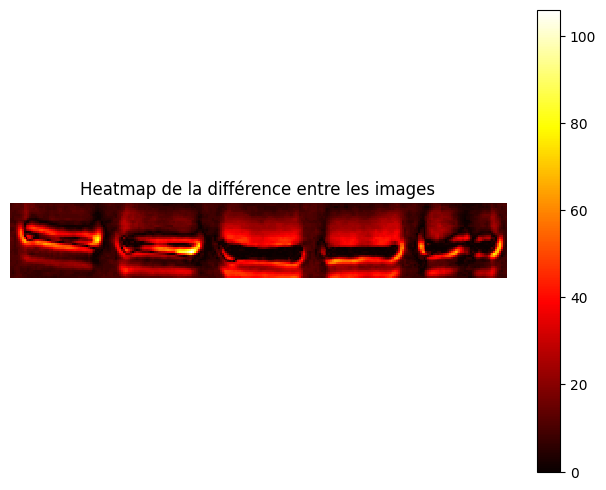
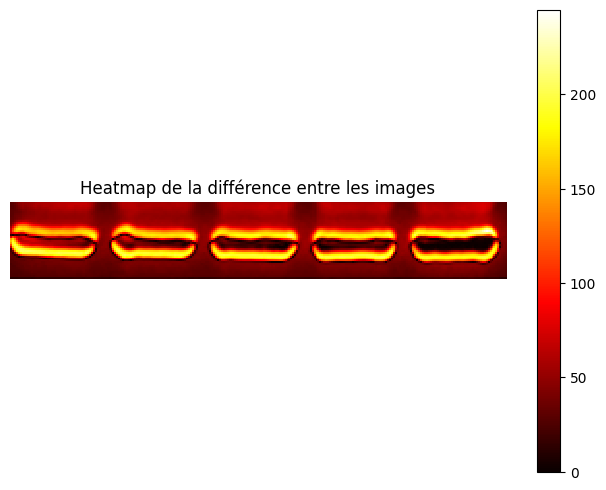
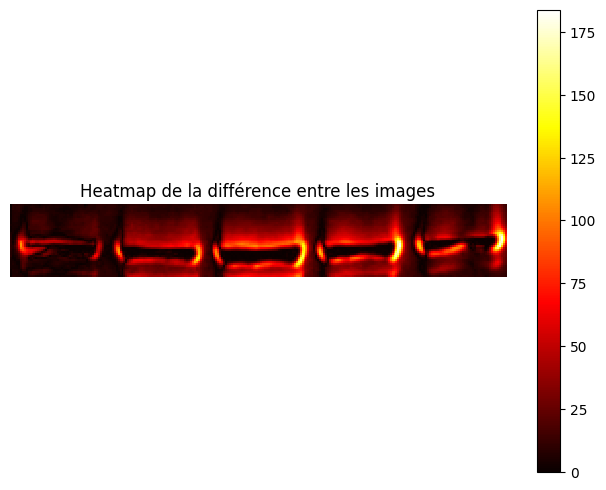
Analyse
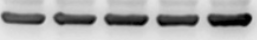
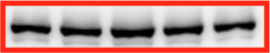
Detected Area


Metrics
| Color | mean-squared error | mean structural similarity | Hausdorff distance | num diff pixels |
|---|---|---|---|---|
| blue | 454.668 | 0.885 | 1.414 | 9781 |
| green | 7124.701 | 0.353 | 2.000 | 10244 |
| red | 1358.615 | 0.760 | 1.414 | 9199 |