
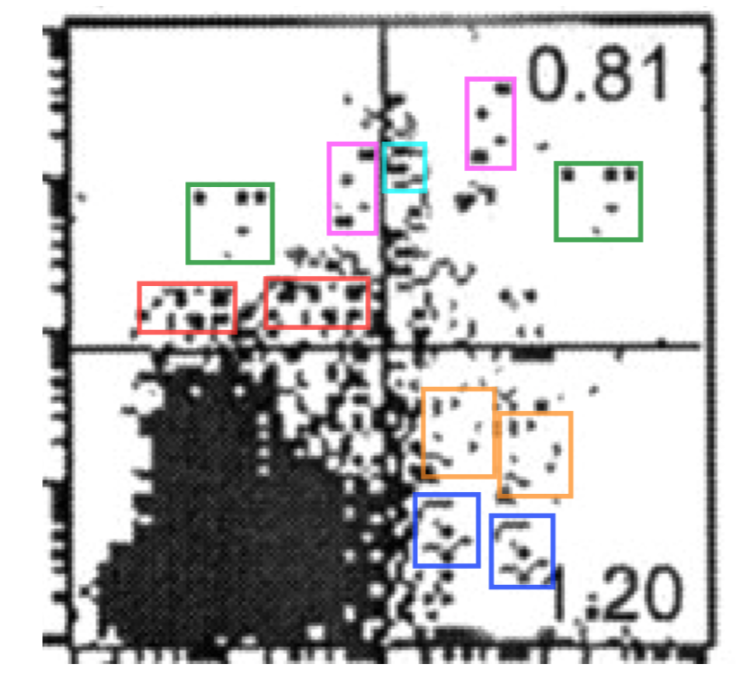
Colored Area Analyse
Image
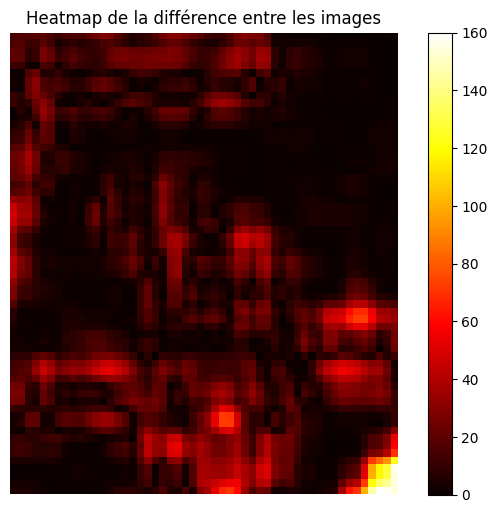
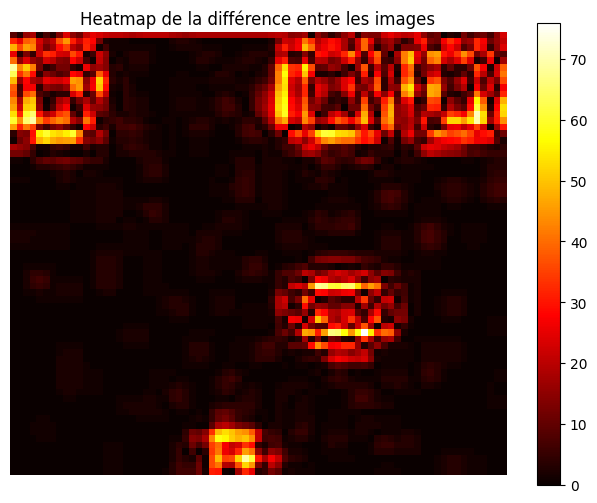
Analyse
Detected Area


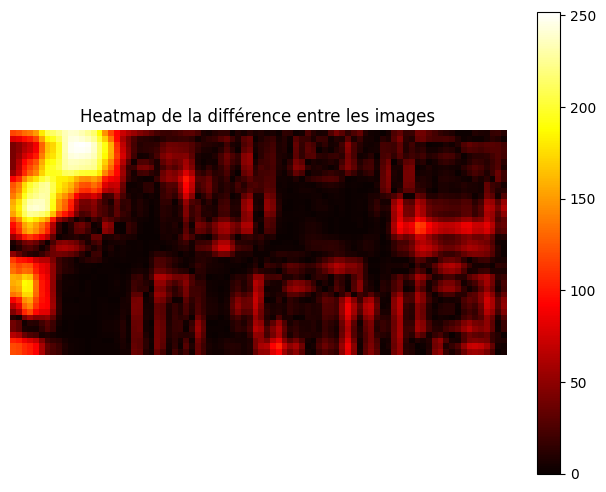
Metrics
| Color | mean-squared error | mean structural similarity | Hausdorff distance | num diff pixels |
|---|---|---|---|---|
| blue | 369.961 | 0.907 | 0.000 | 2862 |
| green | 179.762 | 0.914 | 0.000 | 3287 |
| red | 3505.346 | 0.715 | 0.000 | 3198 |