Report analyse : Production of Bartonella genus-specific monoclonal antibodies
original articleDétection de zones colorées et comparaison d’images
Image Annonated
Informations
Comment:
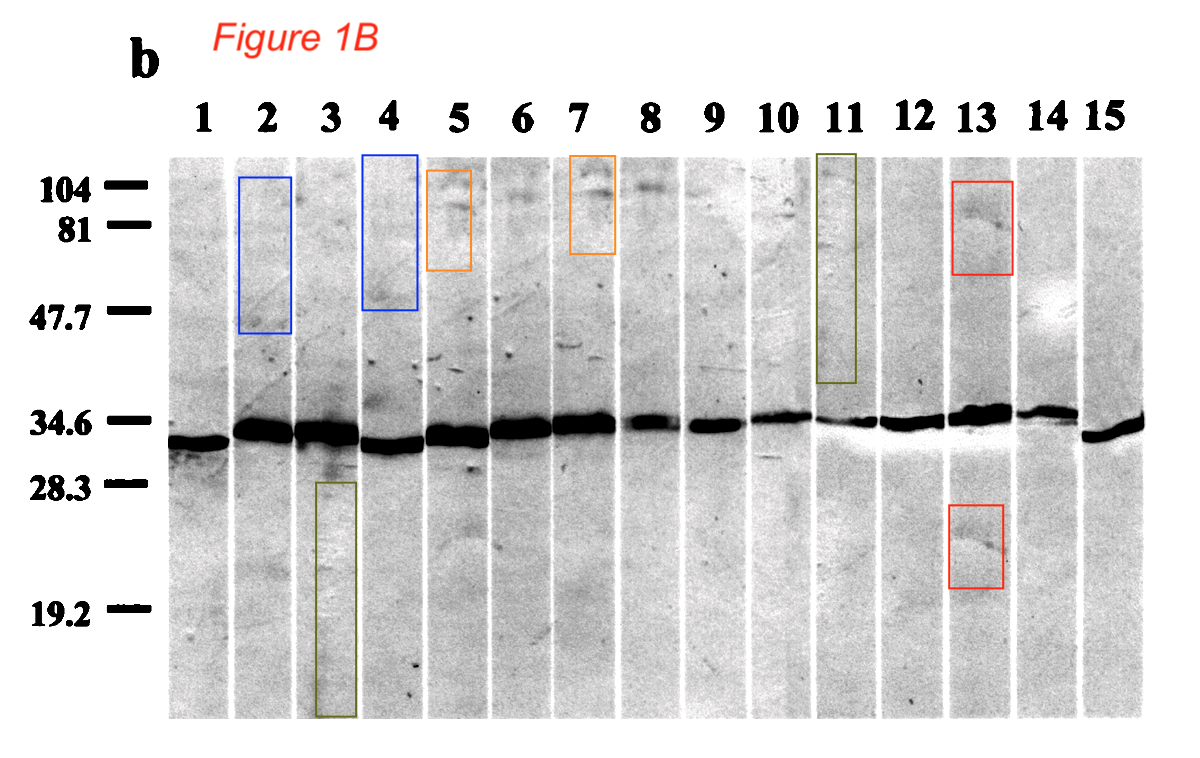
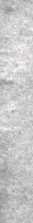
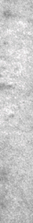
Figure 1B.
Blue, orange, green, and red boxes focus attention to areas in the blot strips that show unexpected similarities.
Image made darker to bring out details.
Would the authors still have the original blots to show? There might be a perfectly fine technical explanation, but I am just curious how such similarities in different parts of the blots could happen.
Abstract: Monoclonal antibodies (MAbs) which react with heat-resistant proteins with molecular masses of 32 to 33 kDa of 14 different Bartonella species were produced. These antibodies did not react with antigens of 26 diverse bacterial strains by microimmunofluorescence assay except MAb B3D4, which reacted with Chlamydia psittaci and Chlamydia trachomatis at low titers. The identification of a common Bartonella antigenic protein will make it possible to later produce a diagnostic antigen by cloning and expressing it in Escherichia coli. Moreover, these MAbs allow all Bartonella species to be identified to the genus level.
Author : Elisabeth M Bik
Abstract: Monoclonal antibodies (MAbs) which react with heat-resistant proteins with molecular masses of 32 to 33 kDa of 14 different Bartonella species were produced. These antibodies did not react with antigens of 26 diverse bacterial strains by microimmunofluorescence assay except MAb B3D4, which reacted with Chlamydia psittaci and Chlamydia trachomatis at low titers. The identification of a common Bartonella antigenic protein will make it possible to later produce a diagnostic antigen by cloning and expressing it in Escherichia coli. Moreover, these MAbs allow all Bartonella species to be identified to the genus level.
Zones détectées : blue red yellow
Date : 12/12/2023
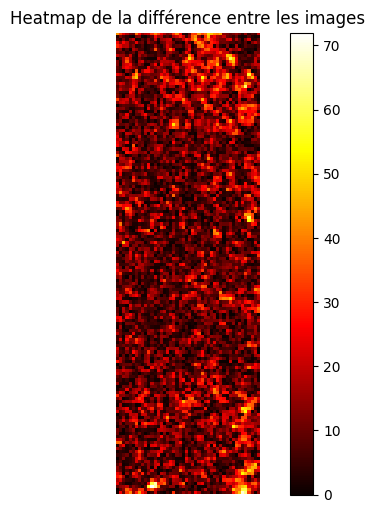
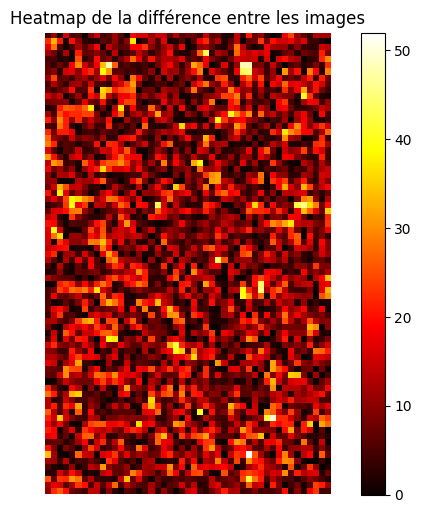
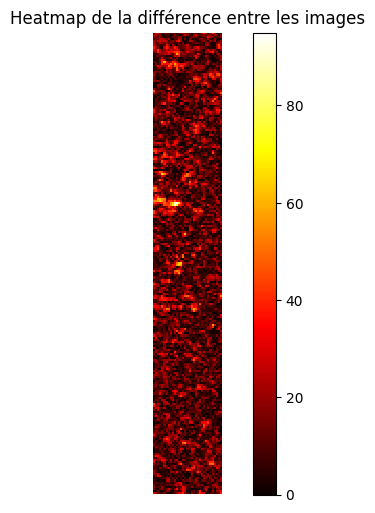
| Color | mean-squared error | mean structural similarity | Hausdorff distance | num diff pixels |
|---|---|---|---|---|
| blue | 250.064 | 0.349 | 0.000 | 6708 |
| red | 209.648 | 0.400 | 0.000 | 3486 |
| yellow | 285.989 | 0.222 | 0.000 | 7254 |
Résultat détaillé par zone
Zone blue
Extrait 1
Extrait 2
Diff animation
Heatmap
Interactive difference
Zone red
Extrait 1

Extrait 2

Diff animation

Heatmap
Interactive difference
Zone yellow
Extrait 1
Extrait 2
Diff animation
Heatmap
Interactive difference